
Tissue Doppler Echocardiography
Tissue Doppler Imaging
Tissue Doppler Imaging (TDI) is a robust and highly reproducible echocardiographic modality that was first described by Isaaz et al in 1989. This modality uses Doppler principles to measure velocity, displacement, event timing or deformation of the myocardium by recording the low Doppler shift frequencies of high energy by the ventricular wall motion that are usually filtered out (high pass filter) in spectral Doppler studies. TDI provides real-time quantification of the myocardial motion throughout the cardiac cycle. TDI can measure circumferential and longitudinal intrinsic myocardial motion velocity in various short-axis and long-axis views. Therefore, it can be used for evaluating both systolic and diastolic function in dogs and cats. Myocardial structures move in the velocity range of a few cm/s to > 20 cm /s. A major disadvantage of TDI is the angle dependency. Furthermore, we recommend high frame rates (>150 fps) for image acquisition with excellent temporal resolution.
TDI can be performed in pulsed-wave and color modes TDI.
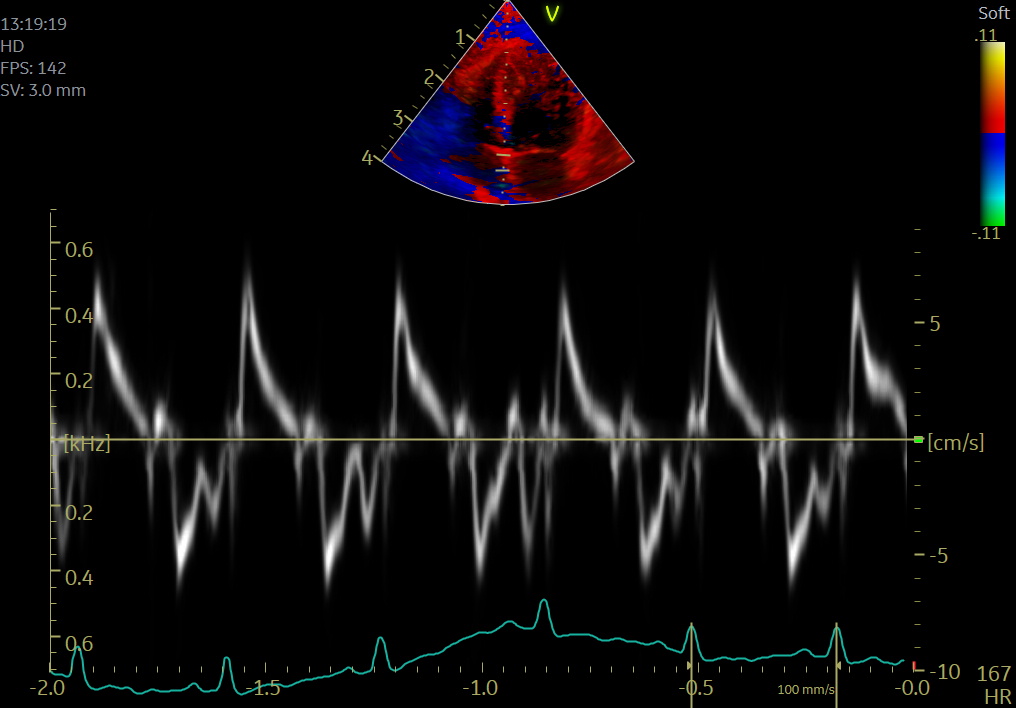
Pulsed-wave TDI provides information on circumferential and longitudinal myocardial movements with high temporal resolution. PW TDI measures peak longitudinal myocardial velocity ”real-time” from a single segment (placement of the sample volume). This method allows for precise velocity quantification.
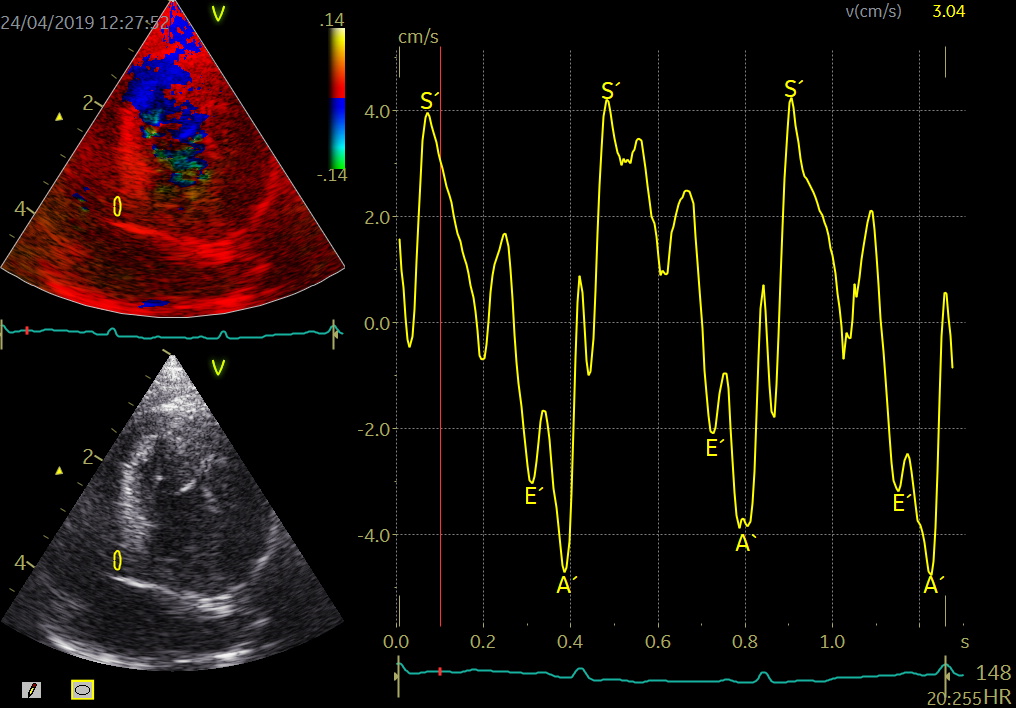
Color TDI (C-TDI) allows superimposing wall motion velocity on two-dimensional echocardiographic imaging by velocity color coding with excellent spatial resolution. C-TDI shows all velocity data at once and gives the best overall picture. Furthermore, C-TDI allows off-line analysis of the transverse and longitudinal myocardial motions. This method can interrogate velocities from multiple sites simultaneously (mean peak velocities approximately 25% lower than pulsed TDI).
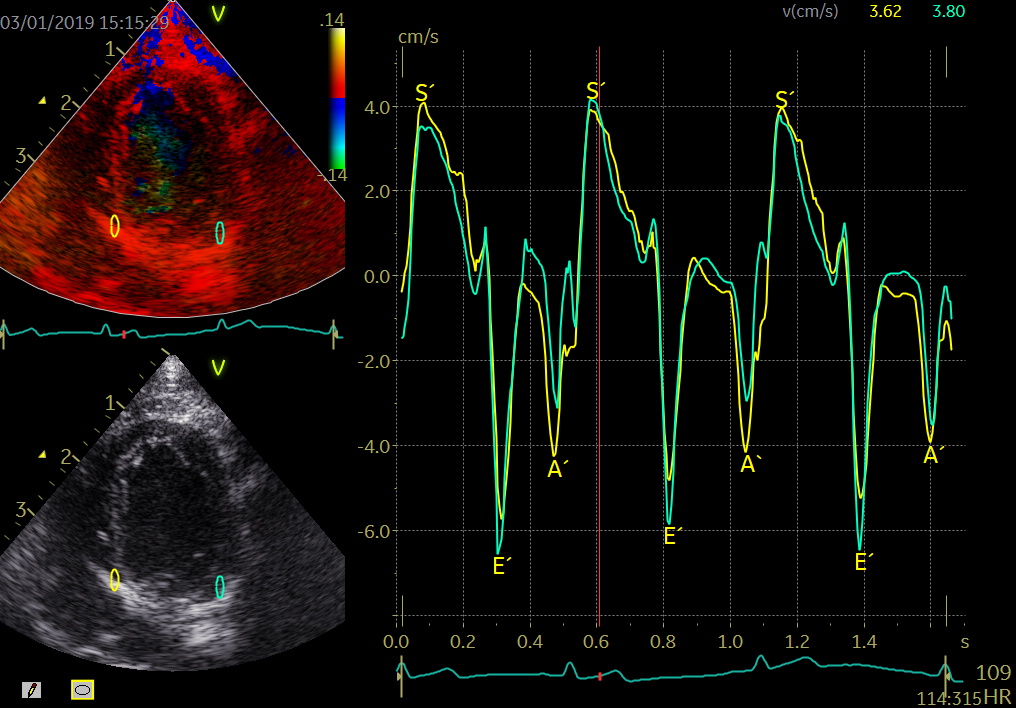
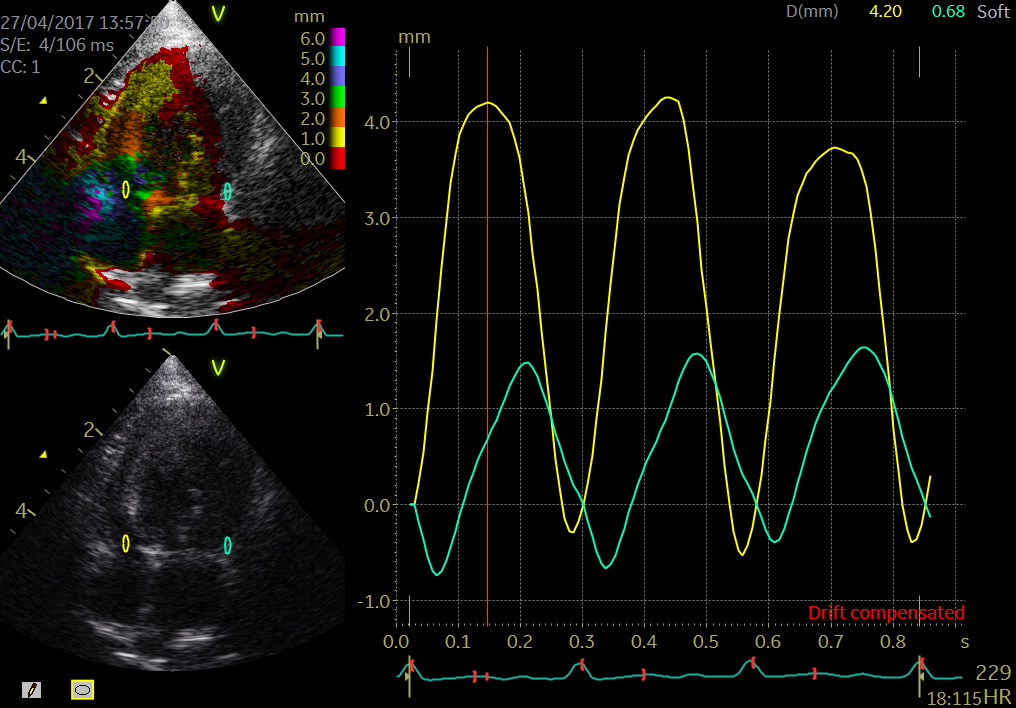
Color TDI derived tissue velocity curves from the mitral annulus (septum and lateral). The curves show velocities towards the probe (positive velocity) in systole, and away from the probe (negative velocities) in diastole. The cardiac cycle is presented by three main waveforms - one positive systolic wave (S´, as the heart base, moves towards the apex in systole) and 2 negative diastolic peaks (E´ represent a passive filling curve and A´ represent the atrial contraction curve, as heart base ascends away from the apex).
Different cTDI methods
- TVI, Strain, Strain rate, displacement, m-mode
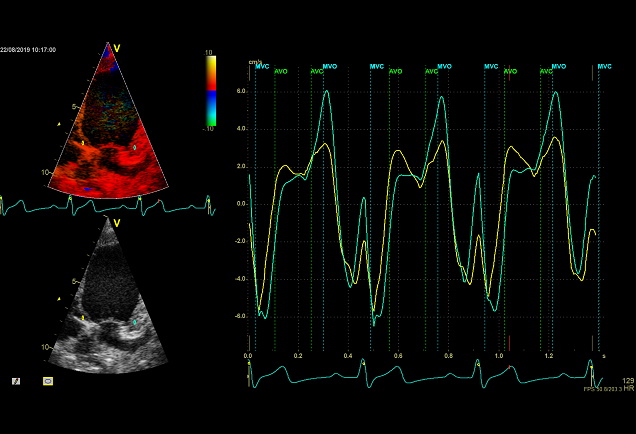
- Tissue Velocity Imaging analyzes myocardial velocities within a color sector. Myocardium moving towards the transducer is colored red and myocardium moving away from the transducer is colored blue. From heart base to apex a velocity gradient can be demonstrated by placing multiple sample volumes. The apex of the heart is almost stationary.
- Displacement or tissue tracking is an easy and robust parameter that can be used in the assessment of the longitudinal function. This TDI technique quantifies only the axial components of velocity, along the direction of the ultrasound wave.
- Strain is a measure of myocardial deformation. Strain is an index of contractile capacity intrinsic to the myocardium which is derived from the myocardial velocity gradient. This signal is strongly subjected noise problems which make interpretation difficult and hardly reproducible.
- Strain rate is the difference in velocity measured between 2 points along the myocardial wall normalized to the distance between the 2 points.
- Color M-mode affords a much higher temporal resolution compared to 2D TDI imaging. In this mode, myocardial velocities are analyzed along a single scan line.
TDI indications
- Assessment of the myocardial function in various heart diseases in dogs and cats
- Systolic dysfunction
- Diastolic dysfunction
- E´/A´< 1
- Longitudinal displacement (systolic parameter)
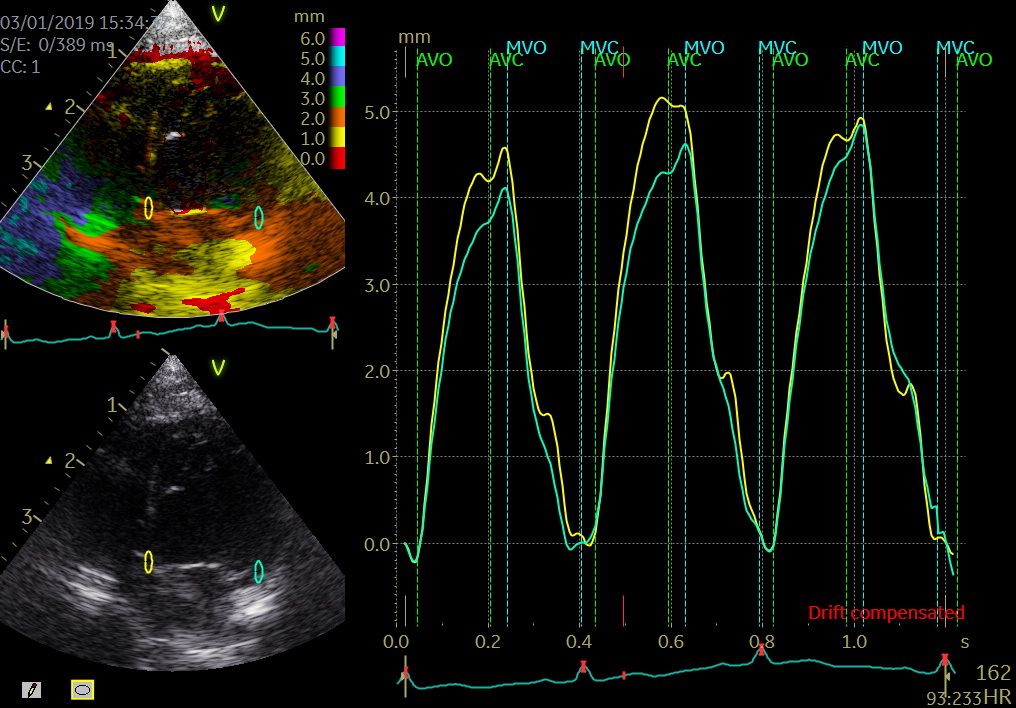
- Tissue tracking (TT) is an offline robust color TDI technique that can be used for a rapid assessment of the myocardial longitudinal displacement. TT displays the integral of tissue velocity as the distance of motion along the axis
- Dyssynchrony
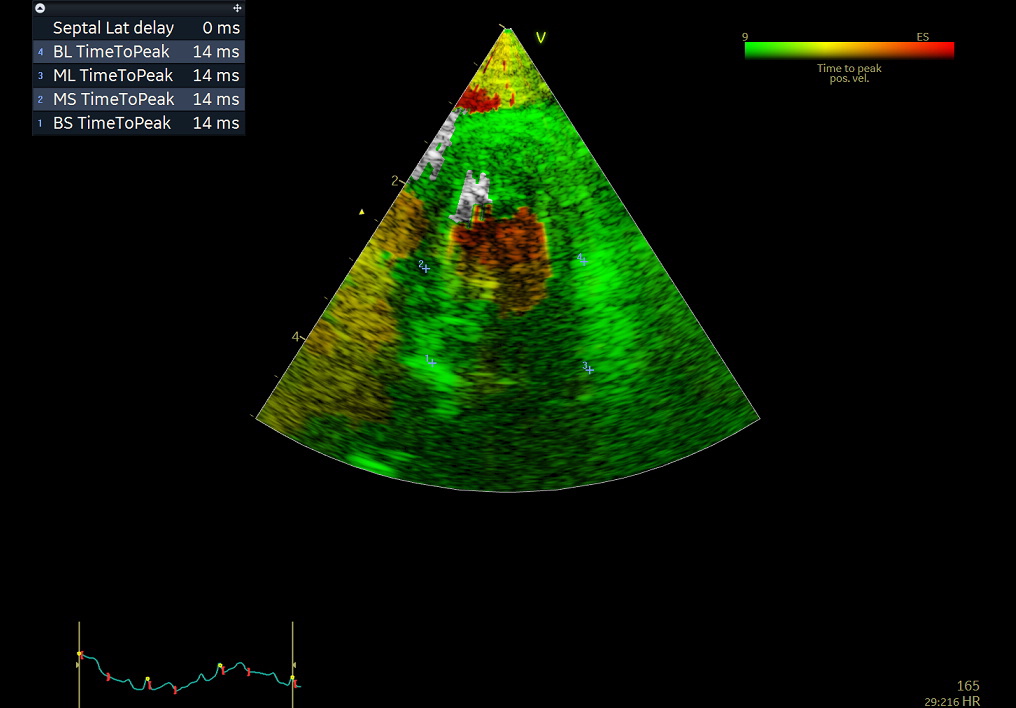
- Tissue Synchronisation Imaging is a new technique to assess left ventricular dyssynchrony. TSI uses a signal‐processing algorithm of tissue Doppler data to automatically detect peak positive velocities.
- Post systolic shortening
- Definition of PSS is a late systolic myocardial shortening appearing after aortic valve closure may be associated with myocardial ischemia.
- E/E´- correlates with the left ventricular filling pressure
- A ratio of mitral peak velocity of early filling (E) to early diastolic mitral annular velocity (E´) – (E/E`)
- Event timing
- Tissue Doppler imaging supplemented by anatomical M-mode images can be used to evaluate the mitral- and aortic valve movements. This allows a reliable analysis of the rapid isovolumic myocardial movements because IVCT, IVRT and LVET can be measured from a single cardiac cycle with the use of a single line through the anterior mitral leaflets (figure)
How to perform tissue velocity imaging (TVI)
- Optimize images/loops (sample rate > 160/min, improve lateral resolution (narrow image width), parallel with ultrasound beam (< 20 degree), velocity scale adjusted to avoid aliasing 8-15 cm/s)
- To measure myocardial and annular velocities
- Transducer position left apical 4CH & 2 CH view
- A small sample volume – 3x1 mm (cats) is placed in the ventricular myocardium adjacent to the mitral annulus (septum and posterior wall (LV)
- Low gain and filter settings
The cardiac cycle is presented by three main waveforms - one positive systolic wave (S´, as heart base, moves towards the apex in systole) and 2 negative diastolic peaks (E´ and A´, as heart base ascends away from the apex).
Limitations
TDI measurements are affected by translation of the heart, tethering and surrounding myocardial motions. Furthermore, TDI is dependent on the angle between the transducer and the direction of myocardial movement. Strain and Strain rate techniques are very dependent on observer experience and excellent data acquisition.
Authors:
Maiken Thode Bach, DVM, Jakob Willesen, DVM, PhD, Jørgen Koch, DVM, PhD
References
- Støylen A. https://folk.ntnu.no/stoylen/strainrate/Basic_Doppler_ultrasound#Tissue_Doppler
- Chetboul V. (2002) Tissue Doppler imaging: A promising technique for quantifying regional myocardial function. Journal of veterinary cardiology: 4(2):7-12. DOI: 10.1016/S1760-2734(06)70033-9
- Koffas H. , Dukes-McEwan J., Corcoran B.M. , Moran CM, A. French A., V. Sboros V., K. Simpson K,, and W.N. McDicken W.N. (2006) Pulsed tissue Doppler imaging in normal cats and cats with hypertrophic cardiomyopathy J Vet Intern Med;20:65–77
- MacDonald, K. A., Kittleson, M. D., Kass, P. H., & Meurs, K. M. (2007). Tissue Doppler imaging in Maine coon cats with a mutation of myosin binding protein C with or without hypertrophy. Journal of Veterinary Internal Medicine, 21(2), 232–237. org/10.1892/0891-6640(2007)21[232:TDIIMC]2.0.CO;2
- Granström, S. Pibber, C.B., Møgelvang, R., Sogaard, P., Willesen, J.L., Koch, J. (2012). Importance of sample volume size and sampling method on feline longitudinal myocardial velocity profiles from color tissue Doppler imaging. Journal of Veterinary Cardiology. Journal of Veterinary Cardiology. ;14(4):479-88. doi: 10.1016/j.jvc.2012.06.001.
- Sugimoto K., Fujii Y., Sunahara H., Aoki T. (2015). Assessment of left ventricular longitudinal function in cats with subclinical hypertrophic cardiomyopathy. J Vet Med Sci. Sep;77(9):1101-8. doi: 10.1292/jvms.14-0354. Epub 2015 Apr 16.
- Granström, S., Godiksen, M.T.N., Christiansen, M., Pipper, C.B., Martinussen, T., Møgelvang, R., Søgaard, P., Willesen, J.L., Koch, J. (2016) Genotype-phenotype correlation between the cardiac myosin binding protein C mutation A31P and hypertrophic cardiomyopathy in a cohort of Maine Coon cats: a longitudinal study. Journal of Veterinary Cardiology (2015) 17, S268eS281.
- Kadappu KK., Thoma L. (2015). Tissue Doppler Imaging in Echocardiography: Value and Limitations, Lung and Circulation (2015) 24, 224–233, http://dx.doi.org/10.1016/j.hlc.2014.10.003
- Nestaas E., Schubert U., , Boode WP DE., El-Khuffash A. (2018) Tissue Doppler velocity imaging and event timings in neonates: a guide to image acquisition, measurement, interpretation, and reference values. Pediatric Research 84: S18–S29; https://doi.org/10.1038/s41390-018-0079-8